

Digital Elevation Models (DEMs) are raster files with elevation data for each raster cell. DEMs are popular for calculations, manipulations and further analysis of an area, and more specifically analysis based on the elevation. ArcGIS has several built-in functions that are very easy to use and will turn the DEM into a derivative map.
Basic Manipulations
There are several basic manipulations that can be done with ArcMap. This involves tools under Spatial Analyst > Surface (the Spatial Analyst extension needs to be turned on in order for this to work properly).
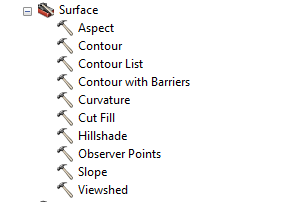
Fig 1: Surface analysis Tools
1. Slope: The DEM can easily be transformed into a slope map with the Slope tool (fig. 2.1). This map describes the slope for each raster cell in degrees based on the elevation at each point.
2. Aspect: Another derivative is the aspect map (fig. 2.2). This map displays the aspect of each raster cell grouped into compass directions (north, northwest, etc.).
3. Hillshade: This tool creates a map with a shade-effect (fig. 2.3) based on the input parameters that are entered in the tool. The resulting map is easier to interpret than the original DEM, because some topographic features are better visible (on small scale especially).
4. Curvature: The curvature map (fig. 2.4) is calculated by using the curvature tool. This basically calculates the relative change in slope, could be seen as a second order DEM derivative.
5. Contour: Topographic contour lines can be plotted with the contour tool (fig. 2.6). Based on the user defined parameters the new map will display (elevation based) contour lines.
6. Viewshed & Observer Points: These tools are used to calculate a (set of) positions relative to a user defined (point) feature (fig. 2.7). This is useful to determine the visibility of a location.
7. Another useful way to display a DEM is to use the “Select attribute” feature (fig. 2.8). By inserting a query and selecting a threshold, it is possible to select certain elevations on the map and display the location of these points.
8. If you want to go a step further, maybe in order to classify the DEM based on elevation, you could use the reclassify tool (fig. 2.9). With the reclassified map it is possible to do a raster calculation in order to calculate a function for each raster cell (with each variable having its own map with values).
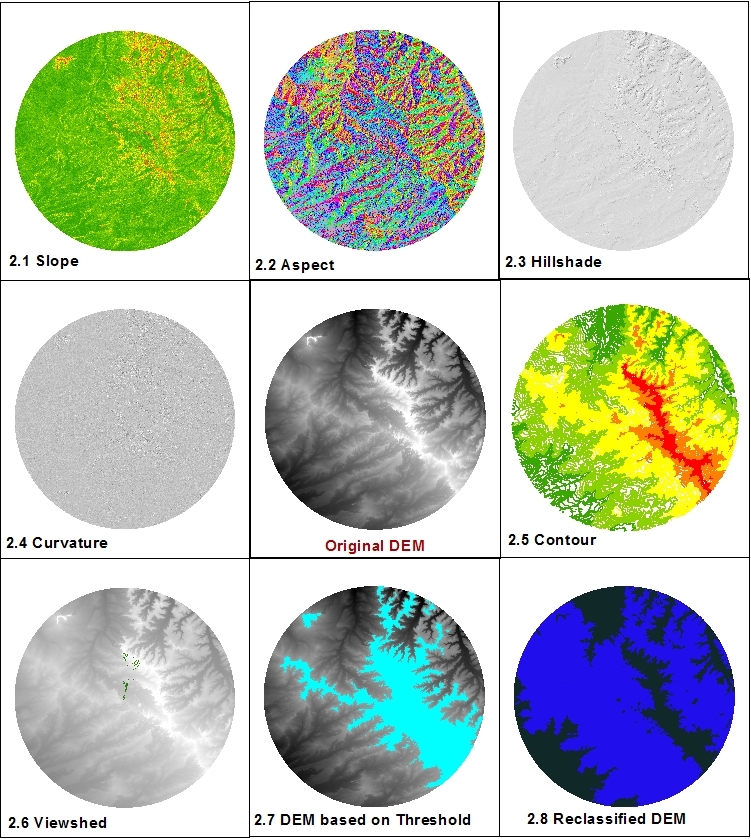 Fig 2: DEM Analysis |
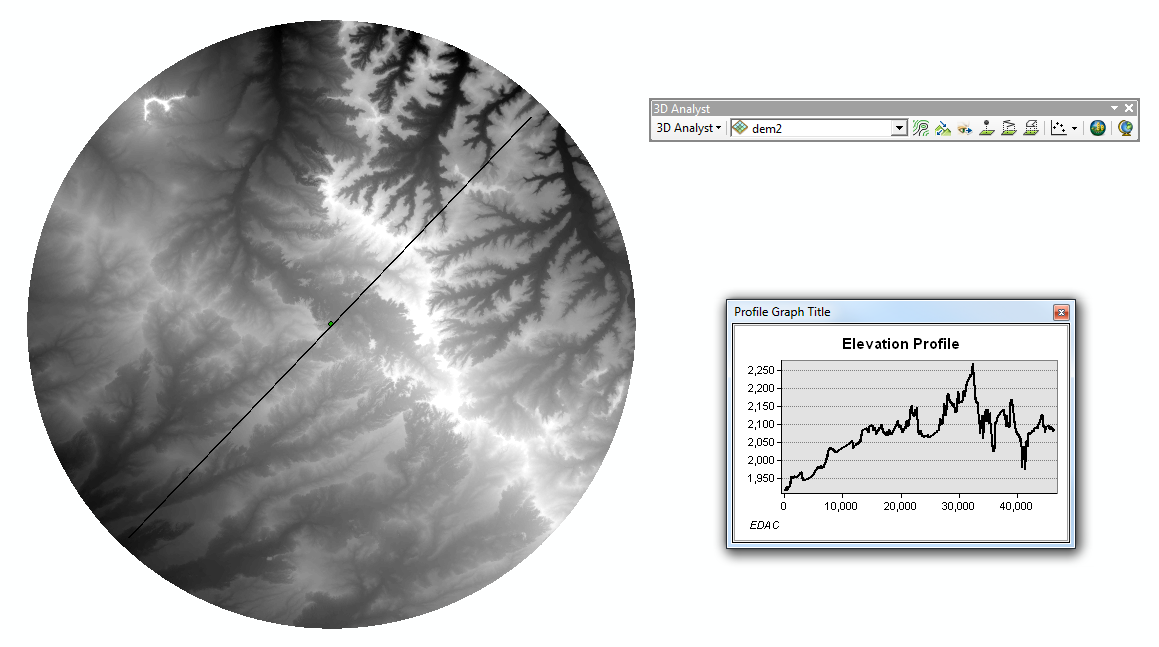 Fig 3: 3D Analyst |
Other possibilities with a DEM include interpolations. With certain tools it is possible to calculate unknown values based on known values that surround these unknown values. There are several ways to interpolate. It is also possible to convert the raster DEM to a vector map, and use vector related manipulations. This will however decrease the quality of the elevation data.
The 3D Analyst tool can also be used to make a topographic profile of a section line in the DEM. This line can be drawn with the 3D analyst tool, and the profile can be made or customized with this tool as well (fig. 3).
In-Depth Analysis
DEMs are good for landscape analysis. There are many more advanced and specialized functions and applications in ArcMap that can be used for analysis. This includes, but is not limited to, hydrologic analysis, geologic and geomorphic analysis and landscape development.
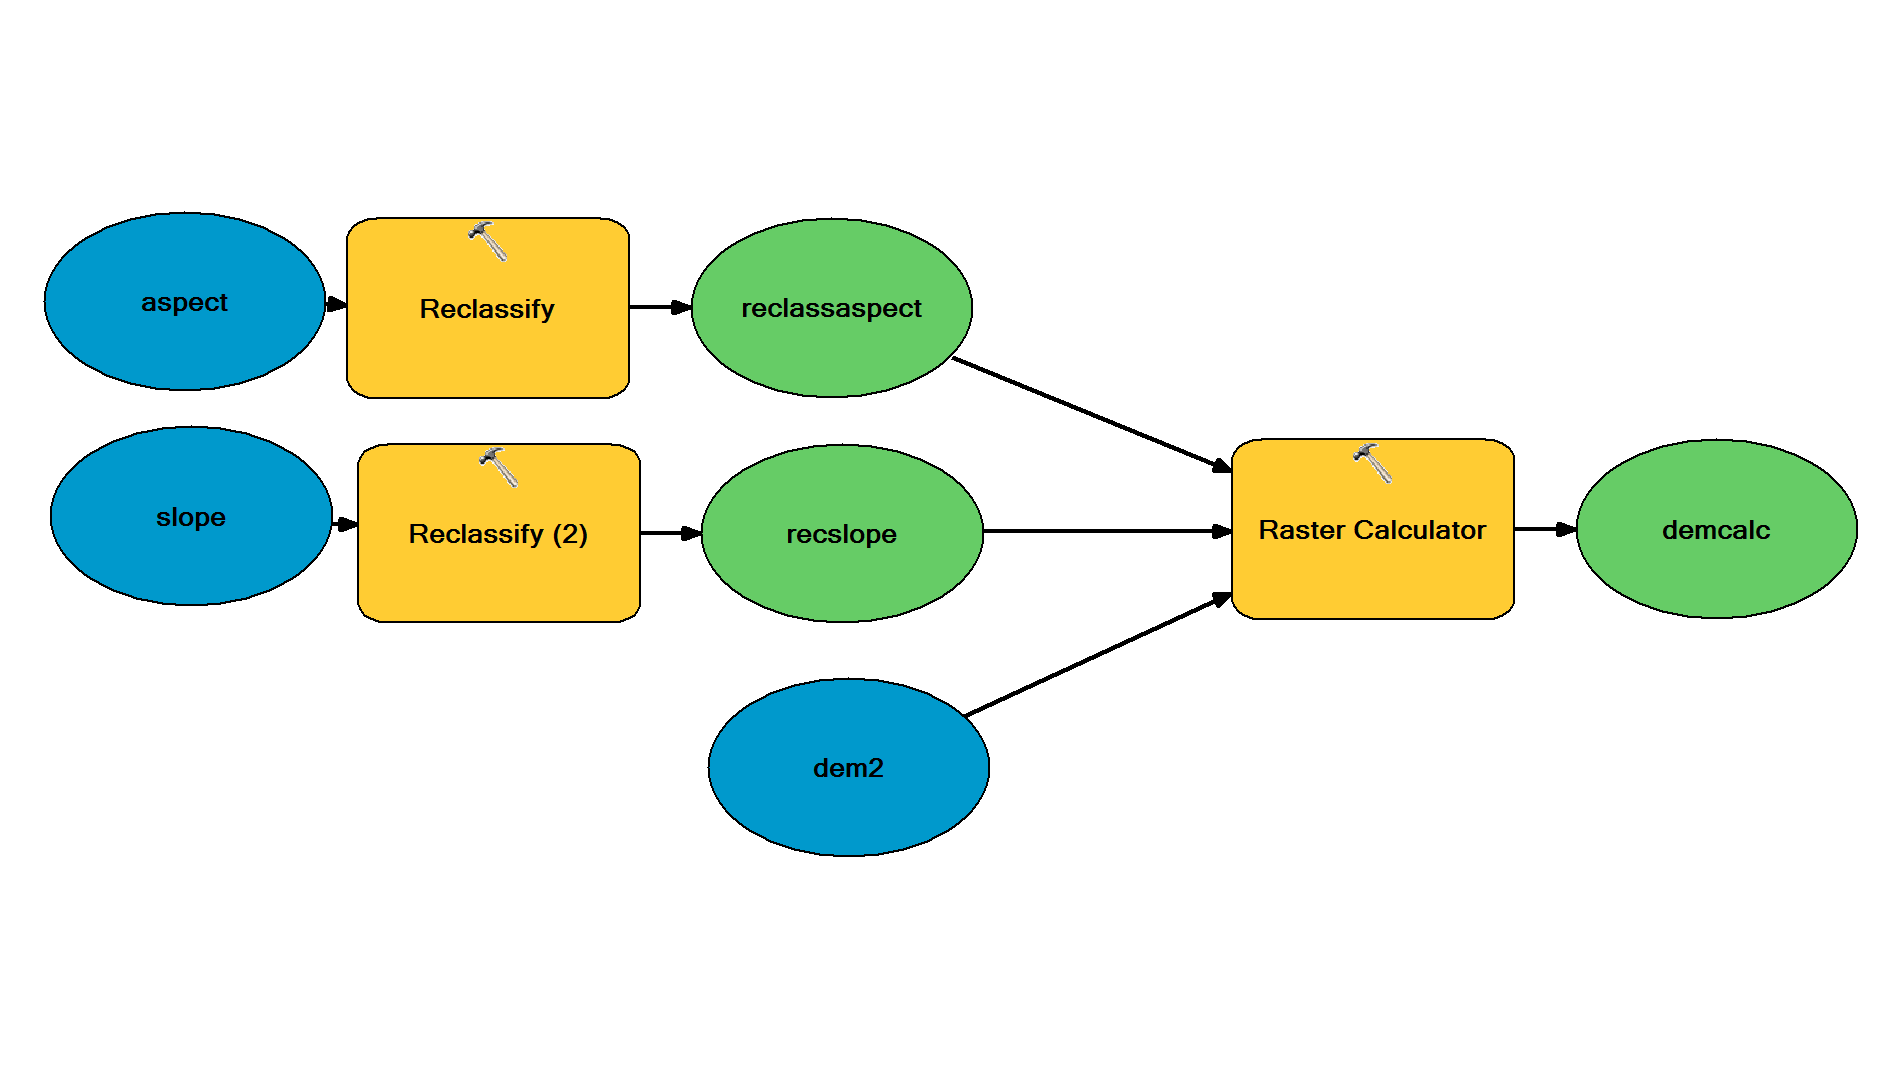
Fig 4: Reclassifying DEM using Model Builder
It is also possible to do calculations with raster data. The DEM elevation values can be used for this, but another option is to reclassify the map and give each class a certain value that is used in a function. This can easily be displayed in a model, which can also be made in ArcMap (fig. 4).
A good example is the Revised Universal Soil Loss Equation (RUSLE). This equation can be calculated by using several maps and manipulating/reclassifying those maps and subsequently use the raster calculator tool. The function is as follows: A= R*K*LS*C*P with A as average annual soil loss, R the rainfall-runoff erosivity factor, K the soil erodibility factor, LS the slope length and steepness factor, C the cover management factor and P the support practice factor. More information about the RUSLE can be found online.
The DEM is a very useful feature in the geospatial analysis. It is used for many research fields and can be manipulated in many ways. The possibilities described in this GIS in Practice are just a summary of all possibilities of a single DEM.
—–
Amar Sitabi
GIS Technician
Earth Data Analysis Center
University of New Mexico.