

Mines in and around New Mexico (Interactive Map)
The recent mine spill on the Animas River has resulted in an increased interest in the locations of current and past mines. We set out to create an interactive Webmap of the mines in the USGS Mineral Resources Data System (MRDS) to give people an opportunity to learn what mining facilities are near them. As we were attempting to map this data and host it online, we ran into a variety of challenges. This short report summarizes our methodology, the challenges we faced, and how we overcame them.
The USGS MRDS site allows you to download data by specific geographic region. We selected New Mexico and the surrounding states. This resulted in a 243 MB shapefile, which is simply too large to serve online. We could have clipped the shapefile to New Mexico, but then the shapefile would be missing mines out of state that eventually make their way into the state, such as the Gold King Mine near Silverton, Colorado. As the spill in the Animas River illustrates, we really need to be aware of mines outside of our political boundaries. Because of this we selected mines that fell within USGS Hydrologic Unit Code 8 (HUC-8) watersheds that intersected New Mexico. Even after clipping out the unnecessary points from our shapefile, we still had a shapefile too large to serve. In an effort to balance file size with completeness, we settled on removing mines that were listed as sand, gravel, and rock. This resulted in a shapefile containing about 7,570 records. Unfortunately, ArcGIS online can only support layers with up to 1,000 features so that tool was not an option for us so we decided to use Leaflet, an open source Javascript mapping library, to create the online map.
As described earlier. File size is an important consideration when serving data online. In addition to the mine locations, we also wanted to show the HUC-8 watersheds that the mines fell within. Complex polygons like watersheds can be very large in size so we needed a way to simplify those polygons. This can be accomplished within ArcMap using the Simplify Polygon tool, but there is no way to see how your data will be impacted until after you run the tool. To simplify our data interactively, we used the online Map Shaper Website. The tool works by uploading your data, selecting a simplification algorithm, and then moving a slider to see the changes to your original data in real time. See below for examples at original, 99%, and 99.89% simplification.
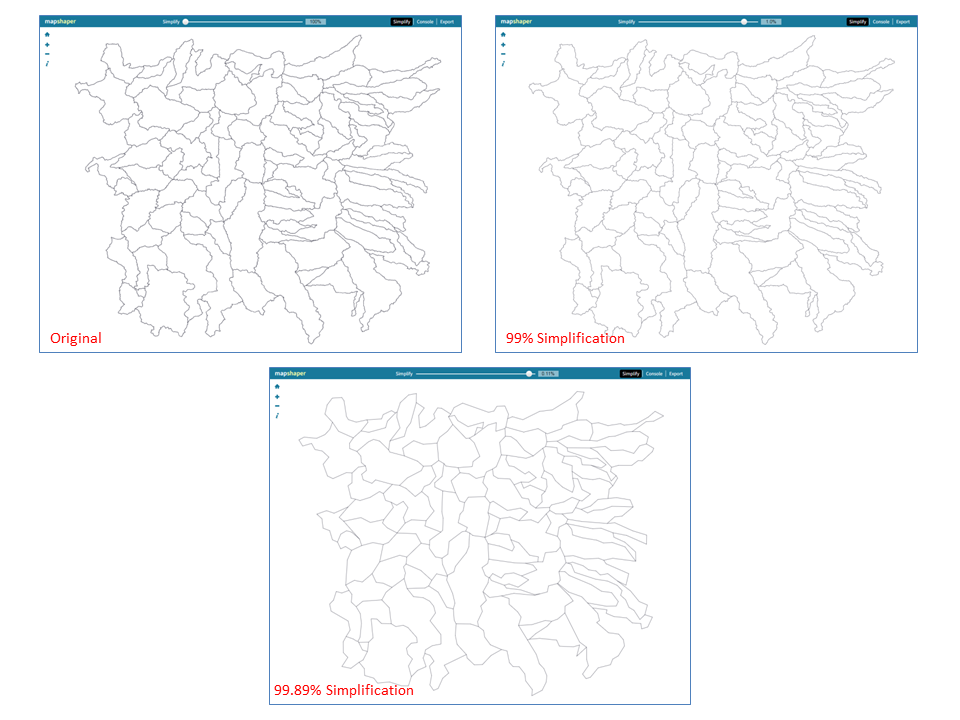
Map Shaper screenshots for HUC Polygons: Original, 99% Simplification and 99.89% Simplification.
We selected the 99% simplification since it did an acceptable job of maintaining watershed shape while significantly reducing file size.
Our next step was converting file formats to work natively with Leaflet. Plug-ins can be used to work with shapefiles, but Leaflet works natively with Geo JSON files so we decided to use that file type. We used QGIS to import our shapefiles, both the mine locations and the watersheds, and save them as GeoJSON files.
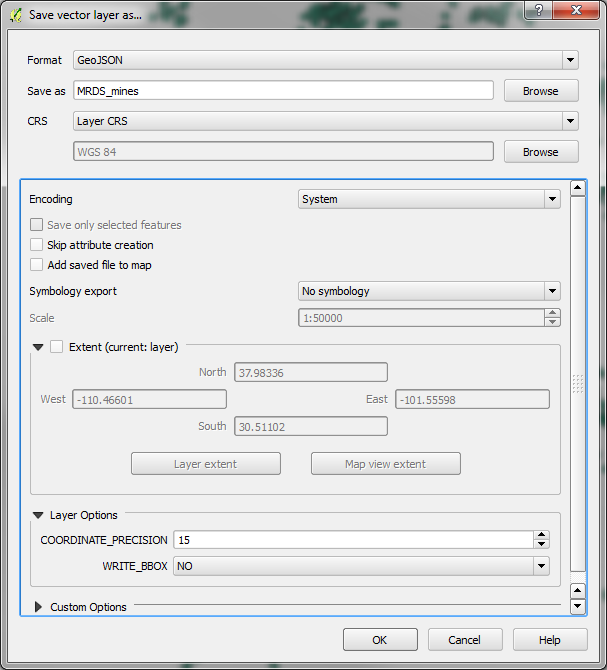
Saving Shapefiles as GeoJSON
With our data in the correct format and a more reasonable file size, it was time to start coding. It quickly became evident that trying to display over 7,000 points was too slow to visualize, often crashing our browser, and made it impossible to read the actual map. We ended up using a Leaflet plug-in called Marker Cluster by Dave Leaver which is designed to group markers and show more detail as you zoom in on your map. This plug-in provided the solution we were looking for. After adding some pop-up information and some background information we were finished with the project.