

In February 2014, Earth Data Analysis Center received a request from the U.S. Senator Martin Heinrich’s office to determine the shrinking state of snow-pack in New Mexico. Our Remote Sensing Specialist performed data analysis using the satellite image data obtained from the National Operational Hydrologic Remote Sensing Center (NOHRSC) at NOAA and ground data obtained from Snow Telemetry (SNOTEL) sites. The satellite images are based on the longer-wave microwave region of the electromagnetic spectrum; these wavelengths are particularly sensitive to moisture in snow and can see through cloud cover.
The snow cover images (below) show the area covered by snow on 2 February 2014 compared to the same area four years ago on 2 February 2010, which was the last year we had a “normal” winter before the drought set in. Areas with thicker snow cover are displayed in darker green.
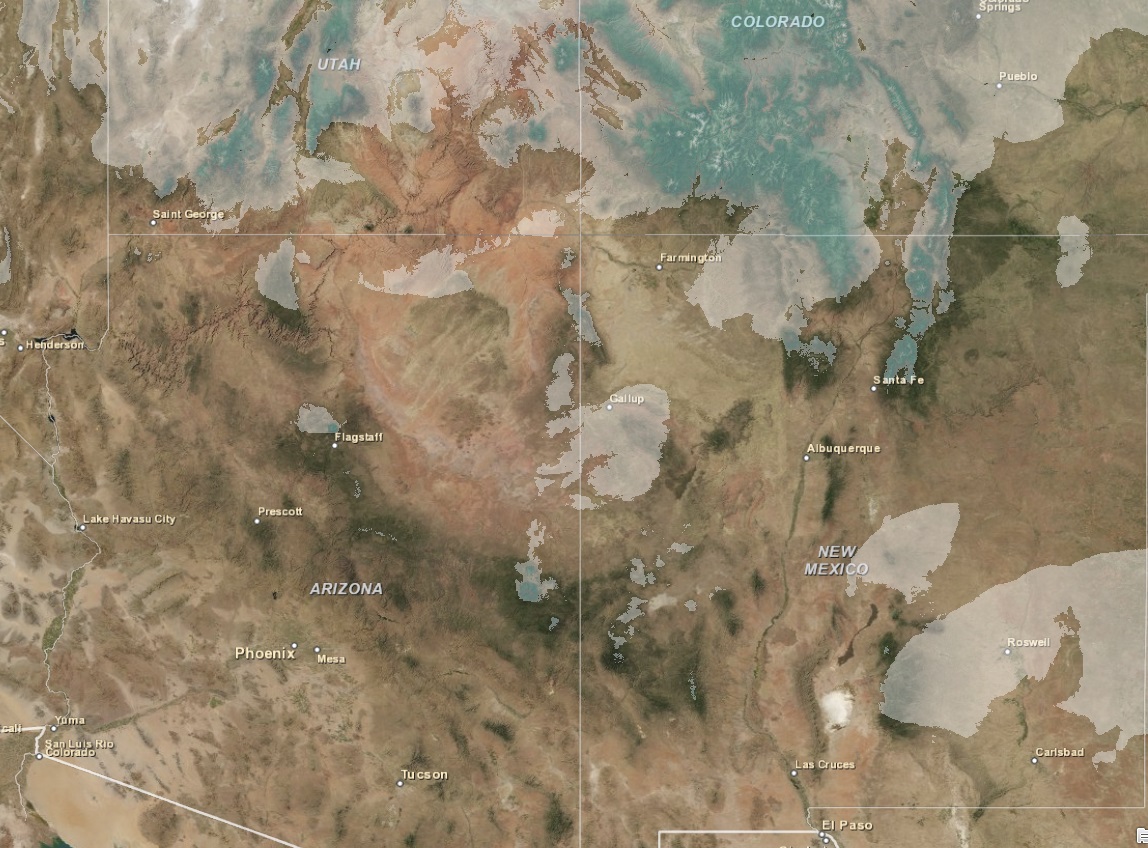 Snow Cover: Satellite Image and SNOTEL Data, 2 February 2014 |
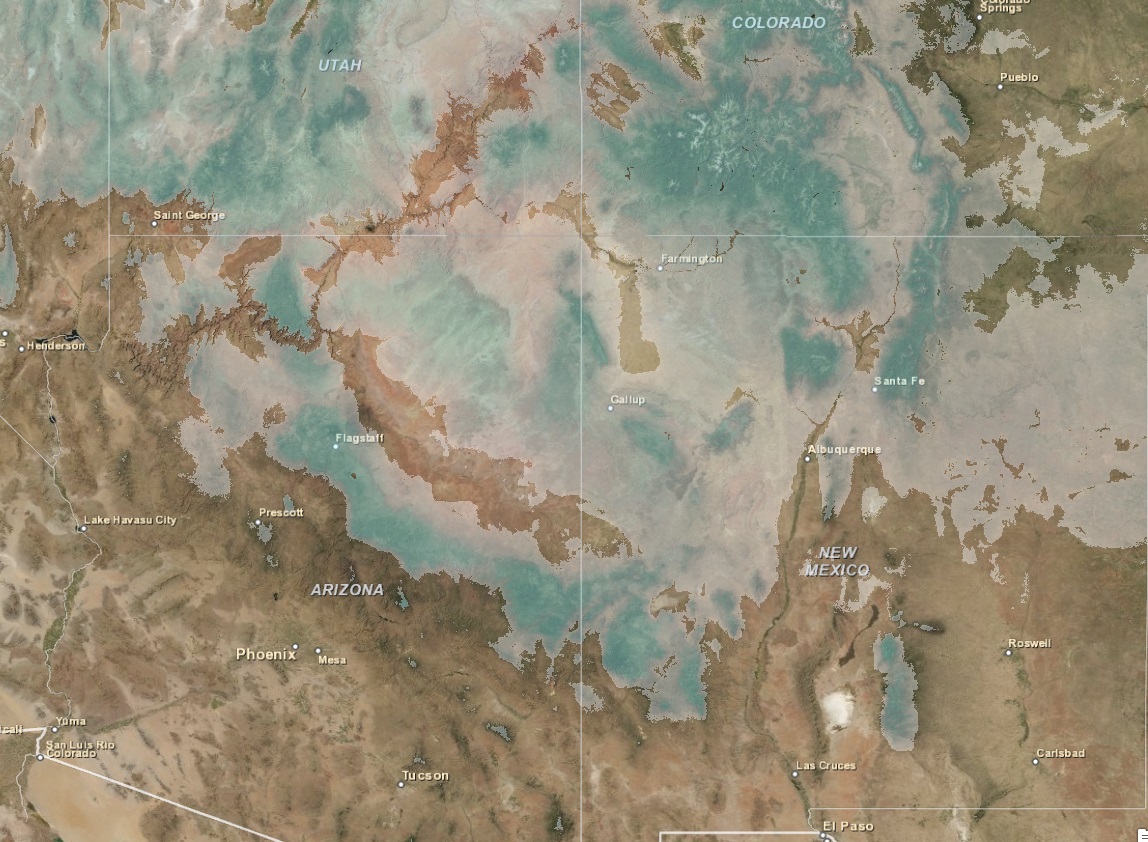 Snow Cover: Satellite Image and SNOTEL Data, 2 February 2010 |
The Snow Water Equivalence (SWE)—which indicates the amount of water contained in the snow, is the most important factor in snow’s effects on our water resources. These SWE images (below) show moisture in the snow, with increasing water content represented by colors ranging from purple (low moisture) to cyan blue (high moisture). Note that most of the mountain areas have high-water-content snow in 2010, whereas in 2014 the high-water-content snow is restricted to the highest peaks in the southern Rockies and is all but absent from the Mogollon, Gila, and Sacramento Mountains to the south.
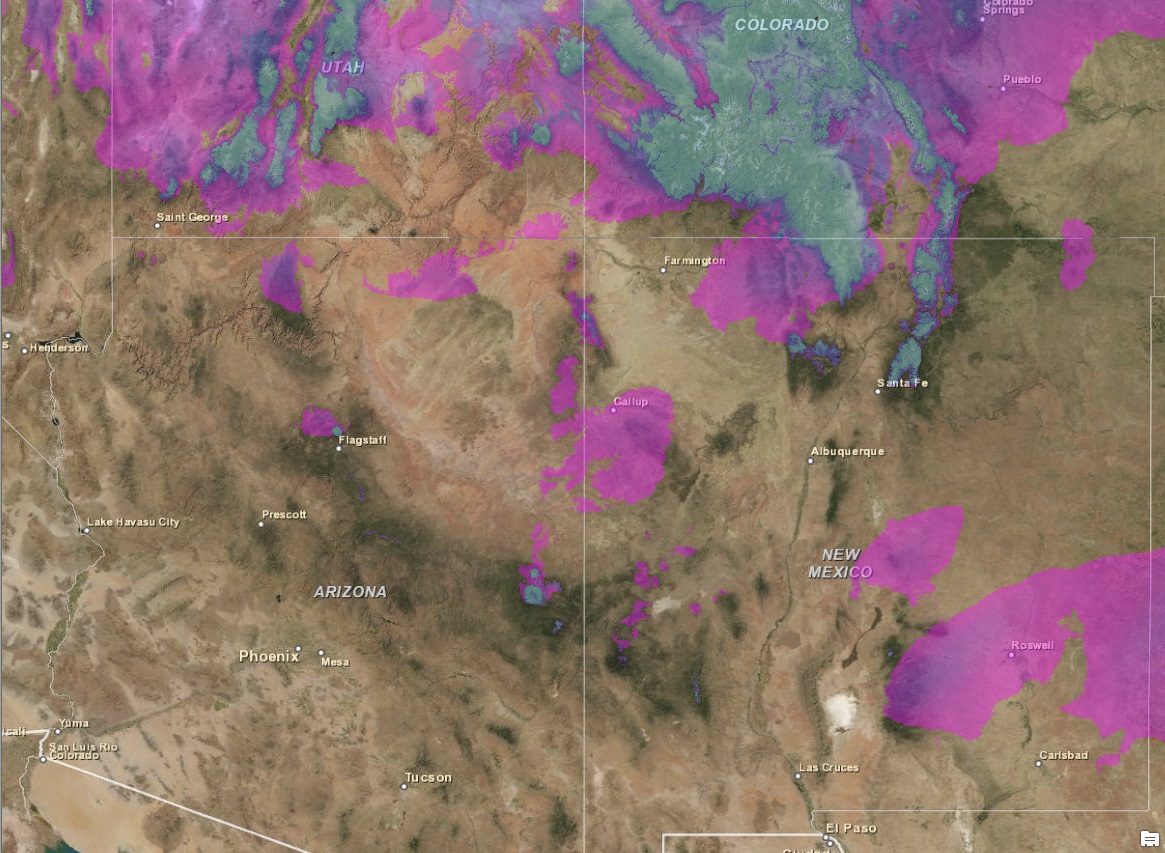 Snow Water Equivalence: Derived from Image and SNOTEL Data, 2 February 2014 |
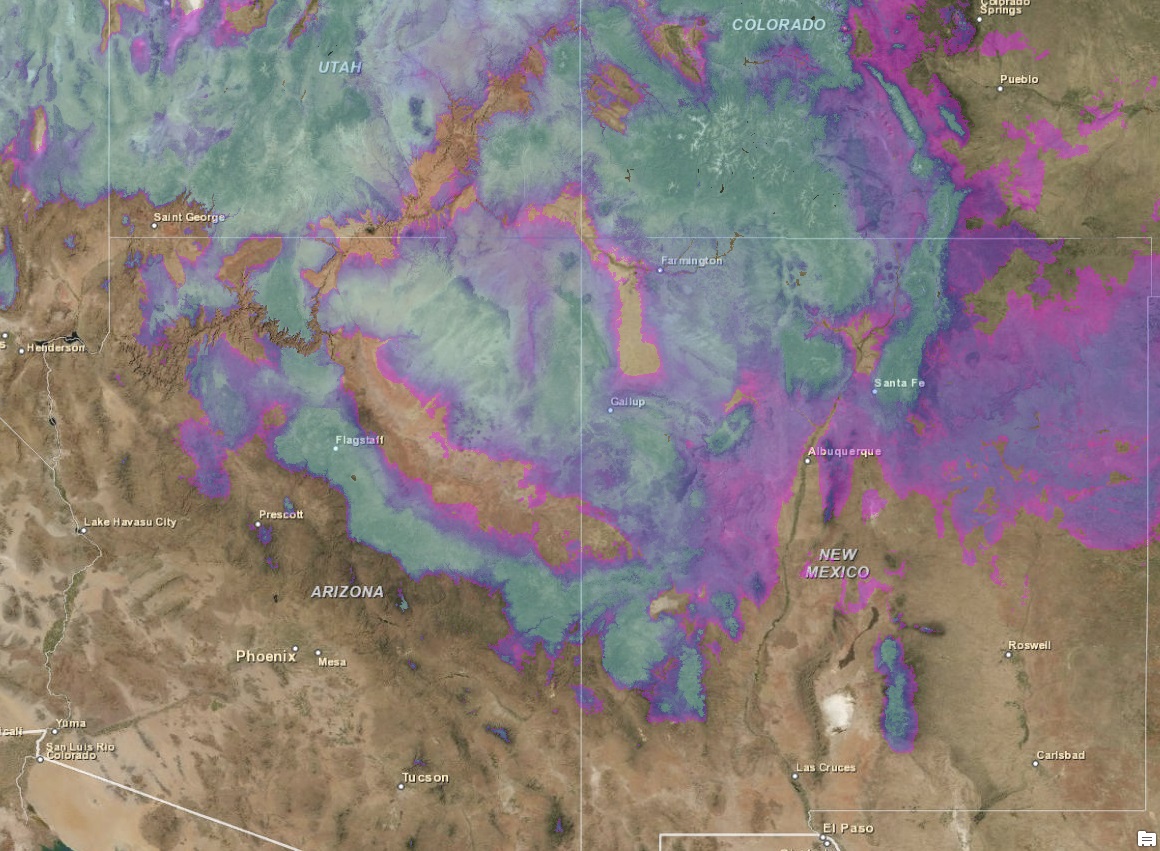 Snow Water Equivalence: Derived from Image and SNOTEL Data, 2 February 2010 |
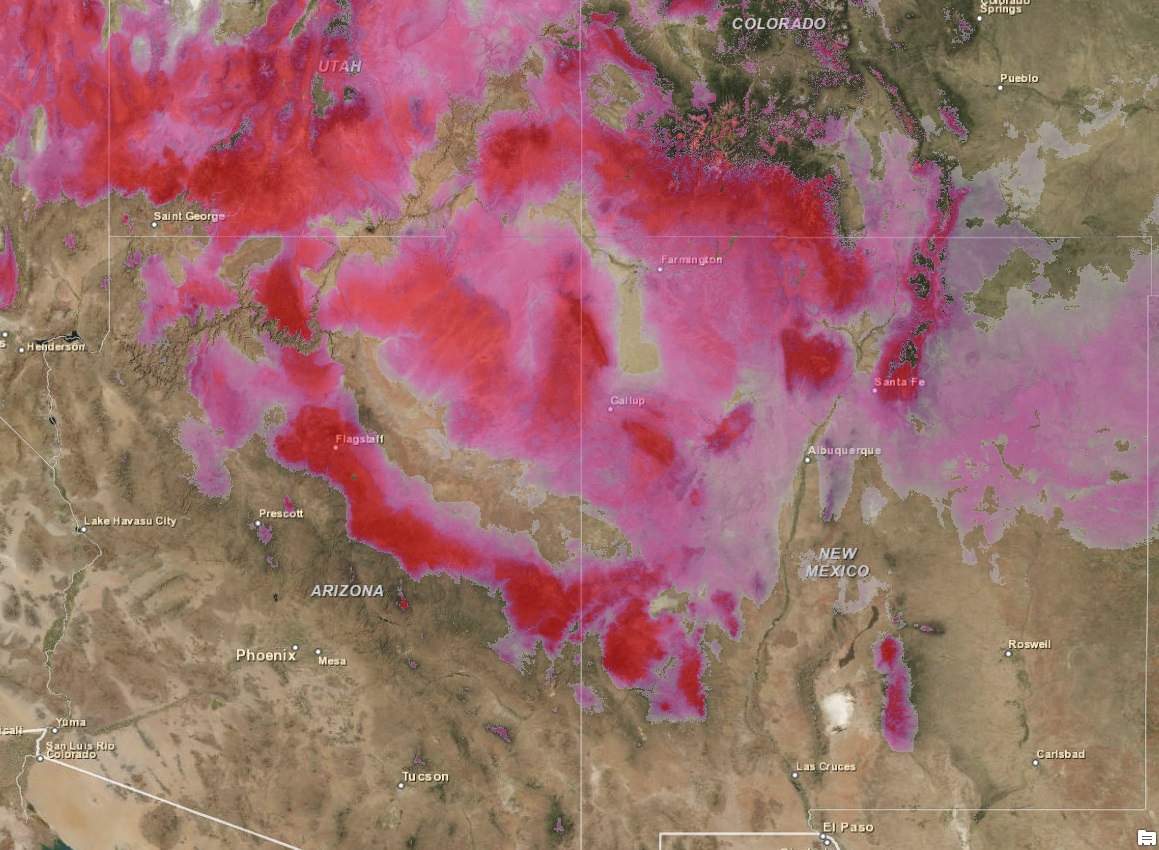
Snow Water Equivalence Difference: February 2010 – February 2014
The image to the right emphasizes the difference in moisture content, which shows the biggest difference between the two dates in Feb 2014 and Feb 2010. The highest drought areas are displayed in darker red. In 2014, Central Rockies did well in snow cover and that is why they show no color.
EDAC provided these images and explanatory narratives to Senator Martin Heinrich’s office in March 2014, and they were used in his presentation to the U.S. Senate. http://www.c-span.org/video/?c4490932/edac-maps.